Benchmark Problem #3
This is a field dataset, recording the Japan 2011 tsunami in Tauranga Harbor, New Zealand. Complete details of the dataset can be found in the accompanying "Tauranga_Data_Background.pdf" with general information about the tsunami impact in New Zealand in the publication "Observations, effects and real time assessment of the March 11, 2011 Tohoku-oki tsunami in New Zealand."The unique component of this benchmark test is to attempt to include the effects of the tides. At the ADCP measurement location, the speed component of the tsunami signal is comparable to the speed of the tidal component, indicating the possibility of a not-linear superposition of the two components.
For this benchmark, we will compare free surface elevation (from tide stations) and velocity information (from and ADCP).
DOWNLOAD DATASET: all_data.zip
SETUP:
Bathymetry (in directory "bathy"):
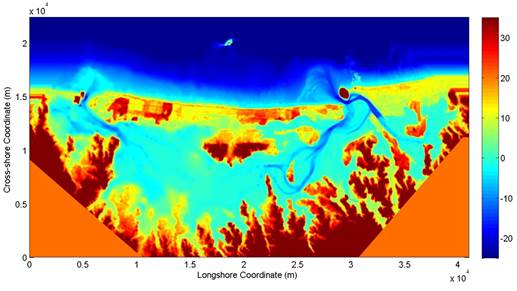
Figure below (the bathymetry data) can be plotted in Matlab with the "plot_bathy.m" script. This dataset has been rotated into longshore and cross-shore coordinates, to facilitate the incident wave forcing along the top domain boundary. Note that modelers may load the (lat,long) bathymetry data directly (if they wish) with the "TAU_Whole_Harbour_10_m_srf6.txt" data file.
Incident Wave (in directory "incident wave")
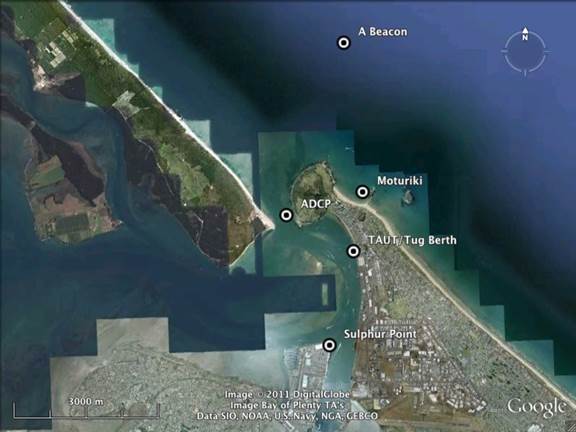
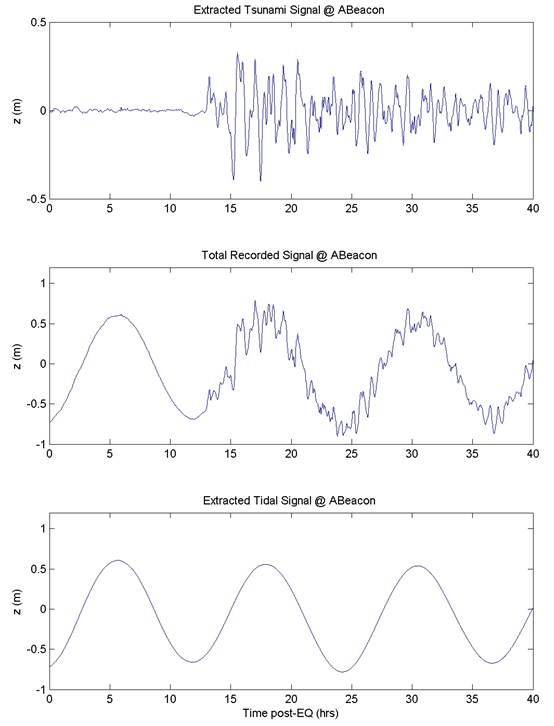
For this case, modelers are asked to drive their simulations with the most offshore measured free surface elevation data. This data location is the ABeacon tide gage, as shown in the image below. This Tide gage is located at the 25 m depth. The water level data at this location can be loaded with the script "load_ABeacon.m," also shown below. There are three separate time series loaded by this file:
1. Tsunami-only signal. This can be used by modelers who do not wish to include the effects of tides.
2. Tide-only signal. This can be used by modelers to ensure that they are modeling the tides, and the tidally-generating currents, correctly
3. Complete signal. This should be used to drive tsunami+tide simulations
Benchmark Data(in directory "comparison data")
Free surface elevation data at
four tidal stations
The
first comparison will be to check the water surface elevation at the numerous tidal
stations. The stations we will focus on here are:
· A Beacon: [lat, long]=( -37.60287, 176.17781 ); [x,y]= (2.724e4, 1.846e4)
· Tug Berth: [lat, long]=( -37.6407, 176.1809 ) ; [x,y]= (3.085e4, 1.512e4)
· Sulphur Point: [lat, long]=( -37.6596, 176.1755 ) ; [x,y]= (2.724e4, 1.846e4)
· Moturiki: [lat, long]=( -37.6307, 176.18377 ) ; [x,y]= (3.005e4, 1.61e4)
Where the above coordinates are given in geographical coordinates as well as the x-y coordinate system of the rotated bathymetry data, as plotted by "plot_bathy.m."
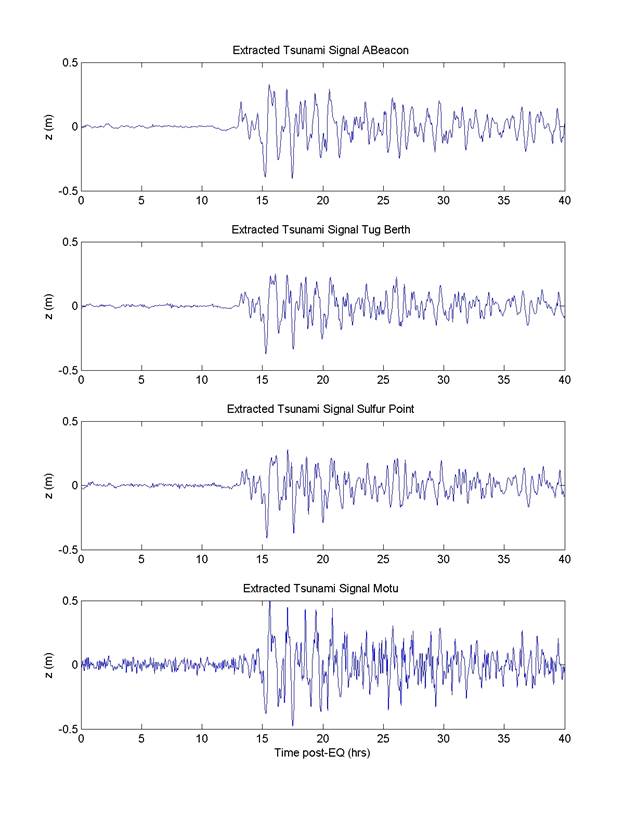
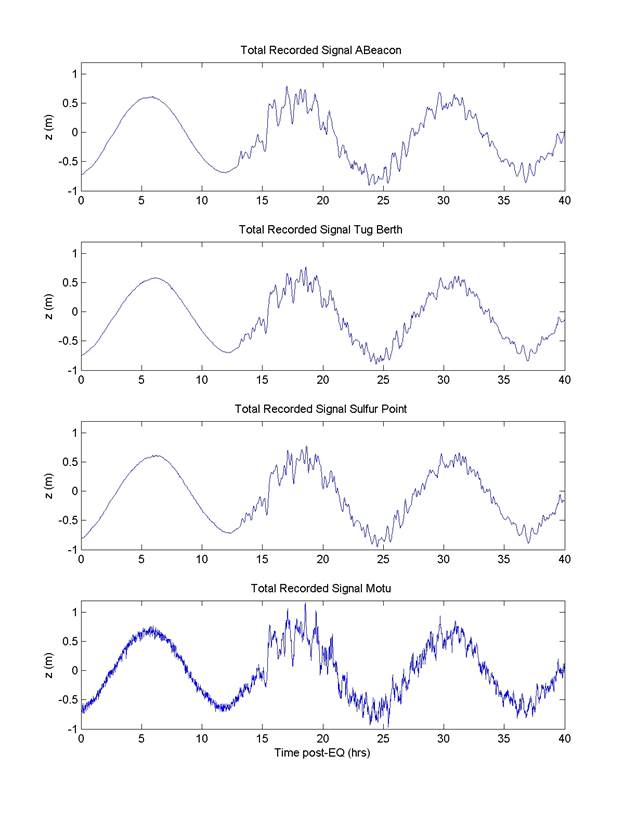
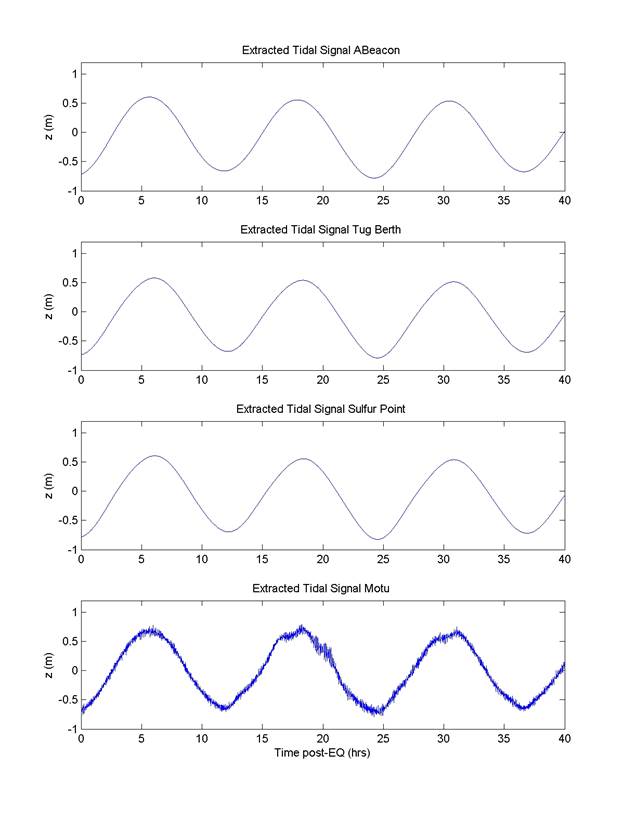
For each of these locations, the script "load_all.m" will plot the time series of the tidal data at each of these four locations in the following figures:
· Figure 1: Water surface elevation for the Tsunami-Only signal
· Figure 2: Water surface elevation for the complete Tsunami+Tide signal
· Figure 3: Water surface elevation for the Tide-only signal
These figures are shown in the following pages. If modelers choose to not include the tidal component in their simulation, then only the data in Figure 1 should be compared. If tides are included, then the data in Figures 2 and 3 should be compared.
Depth-Averaged Horizontal Velocity
data at ADCP location
The
official location of the ADCP is
· ADCP: [lat, long] = (-37.6307, 176.18377), [x,y]=( 2.925e4, 1.466e4)
However, as can be seen in the included ADCP.kmz, the actual location varies in time, as the ADCP is chain anchored. Thus, the velocity measurement location likely changes during the tsunami event, with a maximum radius of ~40m around the official location.
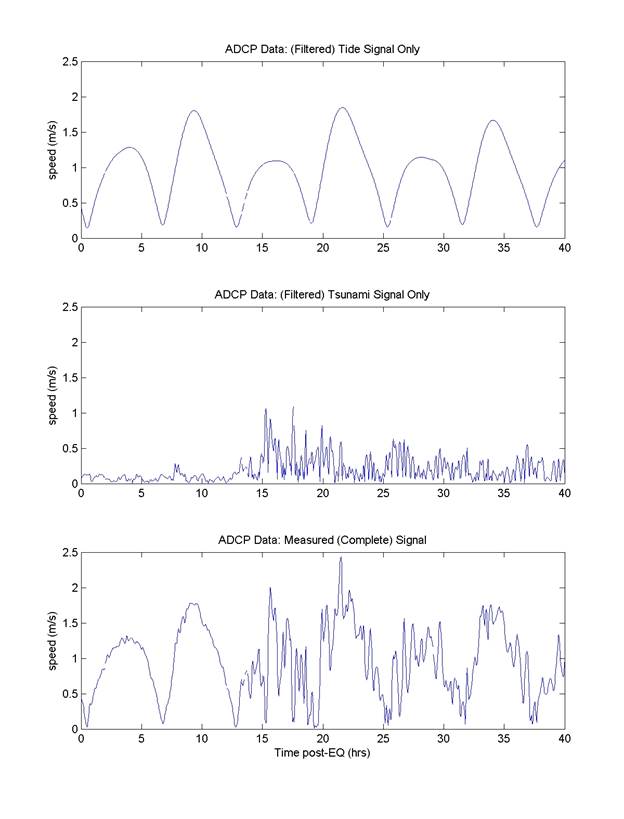
The processed ADCP data can be loaded
& plotted with the "load_all.m" script (Figure 4 from this script), and is shown on the
following pages. If modelers choose to not include the tidal component in their
simulation, then the Tsunami-Only data should be compared. If tides are
included, then the complete and tide-only data can be compared.