Benchmark Problem #5
This experiment has a single solitary wave propagating up a triangular shaped shelf with an island feature located at the offshore point of the shelf. Free surface information was recorded via resistance-type wave gauges and sonic wave gages. Velocity information was recorded via ADV's. Note that is the same test case as used during the 2009 ISEC Workshop. Additional information from that workshop can be found here. For reference, a few videos of the lab trials can be seen below:
 Solitary wave past island on shelf OSU
 Solitary wave past island on shelf OSU dye study
 Solitary wave past island on shelf OSU PIV video
For this benchmark, we will compare free surface, velocity, and turbulence information recorded throughout the tank.
DOWNLOAD DATASET: all_data.zip
SETUP:
Water depth @ Wavemaker: 0.78m
Solitary wave height @ wavemaker: 0.39m
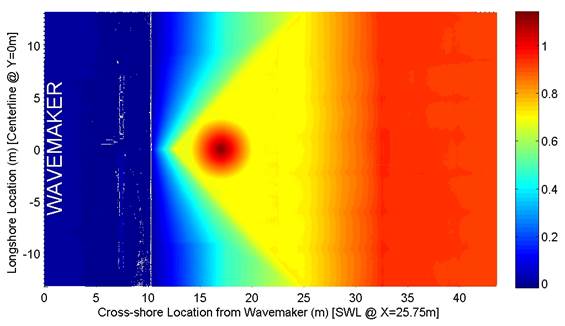
Bathymetry (in directory "bathy"):
The figure below (the bathymetry data) can be plotted in Matlab with the "plot_bathy.m" script.
Benchmark Data (in directory "comparison data")
The following data should be compared with the numerical model output.
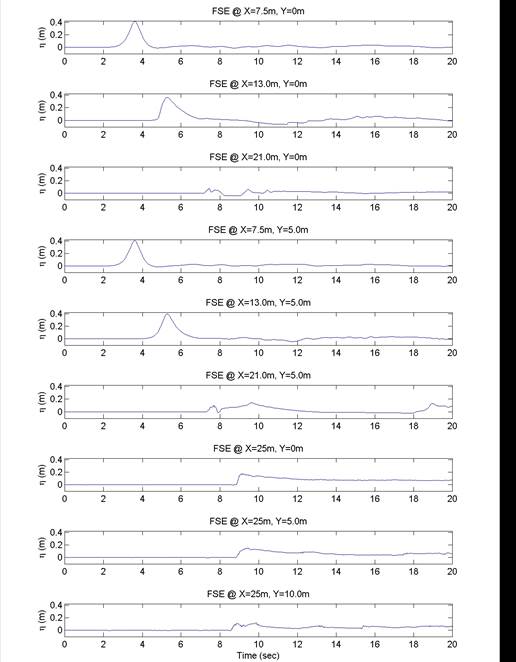
Free Surface Elevation Measurements (can be plotted with "plot_WG.m" script)
Recorded @ y=0 (centerline of basis) at following x-locations:
X=7.5m, 13.0m, 21.0 m
Recorded @ y=5.0 at following x-locations:
X=7.5m, 13.0m, 21.0 m
Recorded @ x=25 at following y-locations:
Y=0.0 m, 5.0m, 10.0 m
Benchmark Data
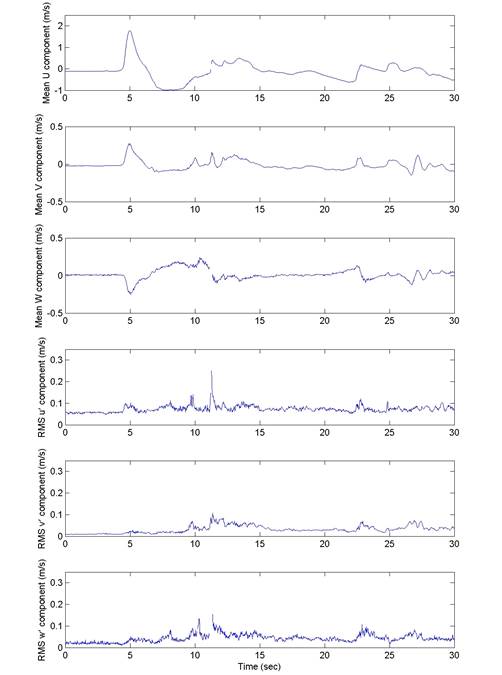
Velocity and Turbulence Measurements (can be plotted with "plot_ADV.m" script)
Recorded @ x=13m, y=0m, z=0.75 m (3 cm below still water level)
Mean and RMS turbulence fluctuations for the three velocity components are provided.
Recorded @ x=21m, y=0m, z=0.77 m (1 cm below still water level)
Mean and RMS turbulence fluctuations for the three velocity components are provided.
Recorded @ x=21m, y=-5m, z=0.77 m (1 cm below still water level)
Mean and RMS turbulence fluctuations for the three velocity components are provided.